Build a Server Management Dashboard with Rails UI
Create infrastructure dashboards for PaaS, hosting, or DevOps tools. Server monitoring, deployments, and resource management interfaces ready to use.
The challenge
Infrastructure dashboards require dense information displays: server status, resource usage graphs, deployment logs, and configuration panels. Presenting this data clearly while remaining actionable is a design challenge.
The Rails UI solution
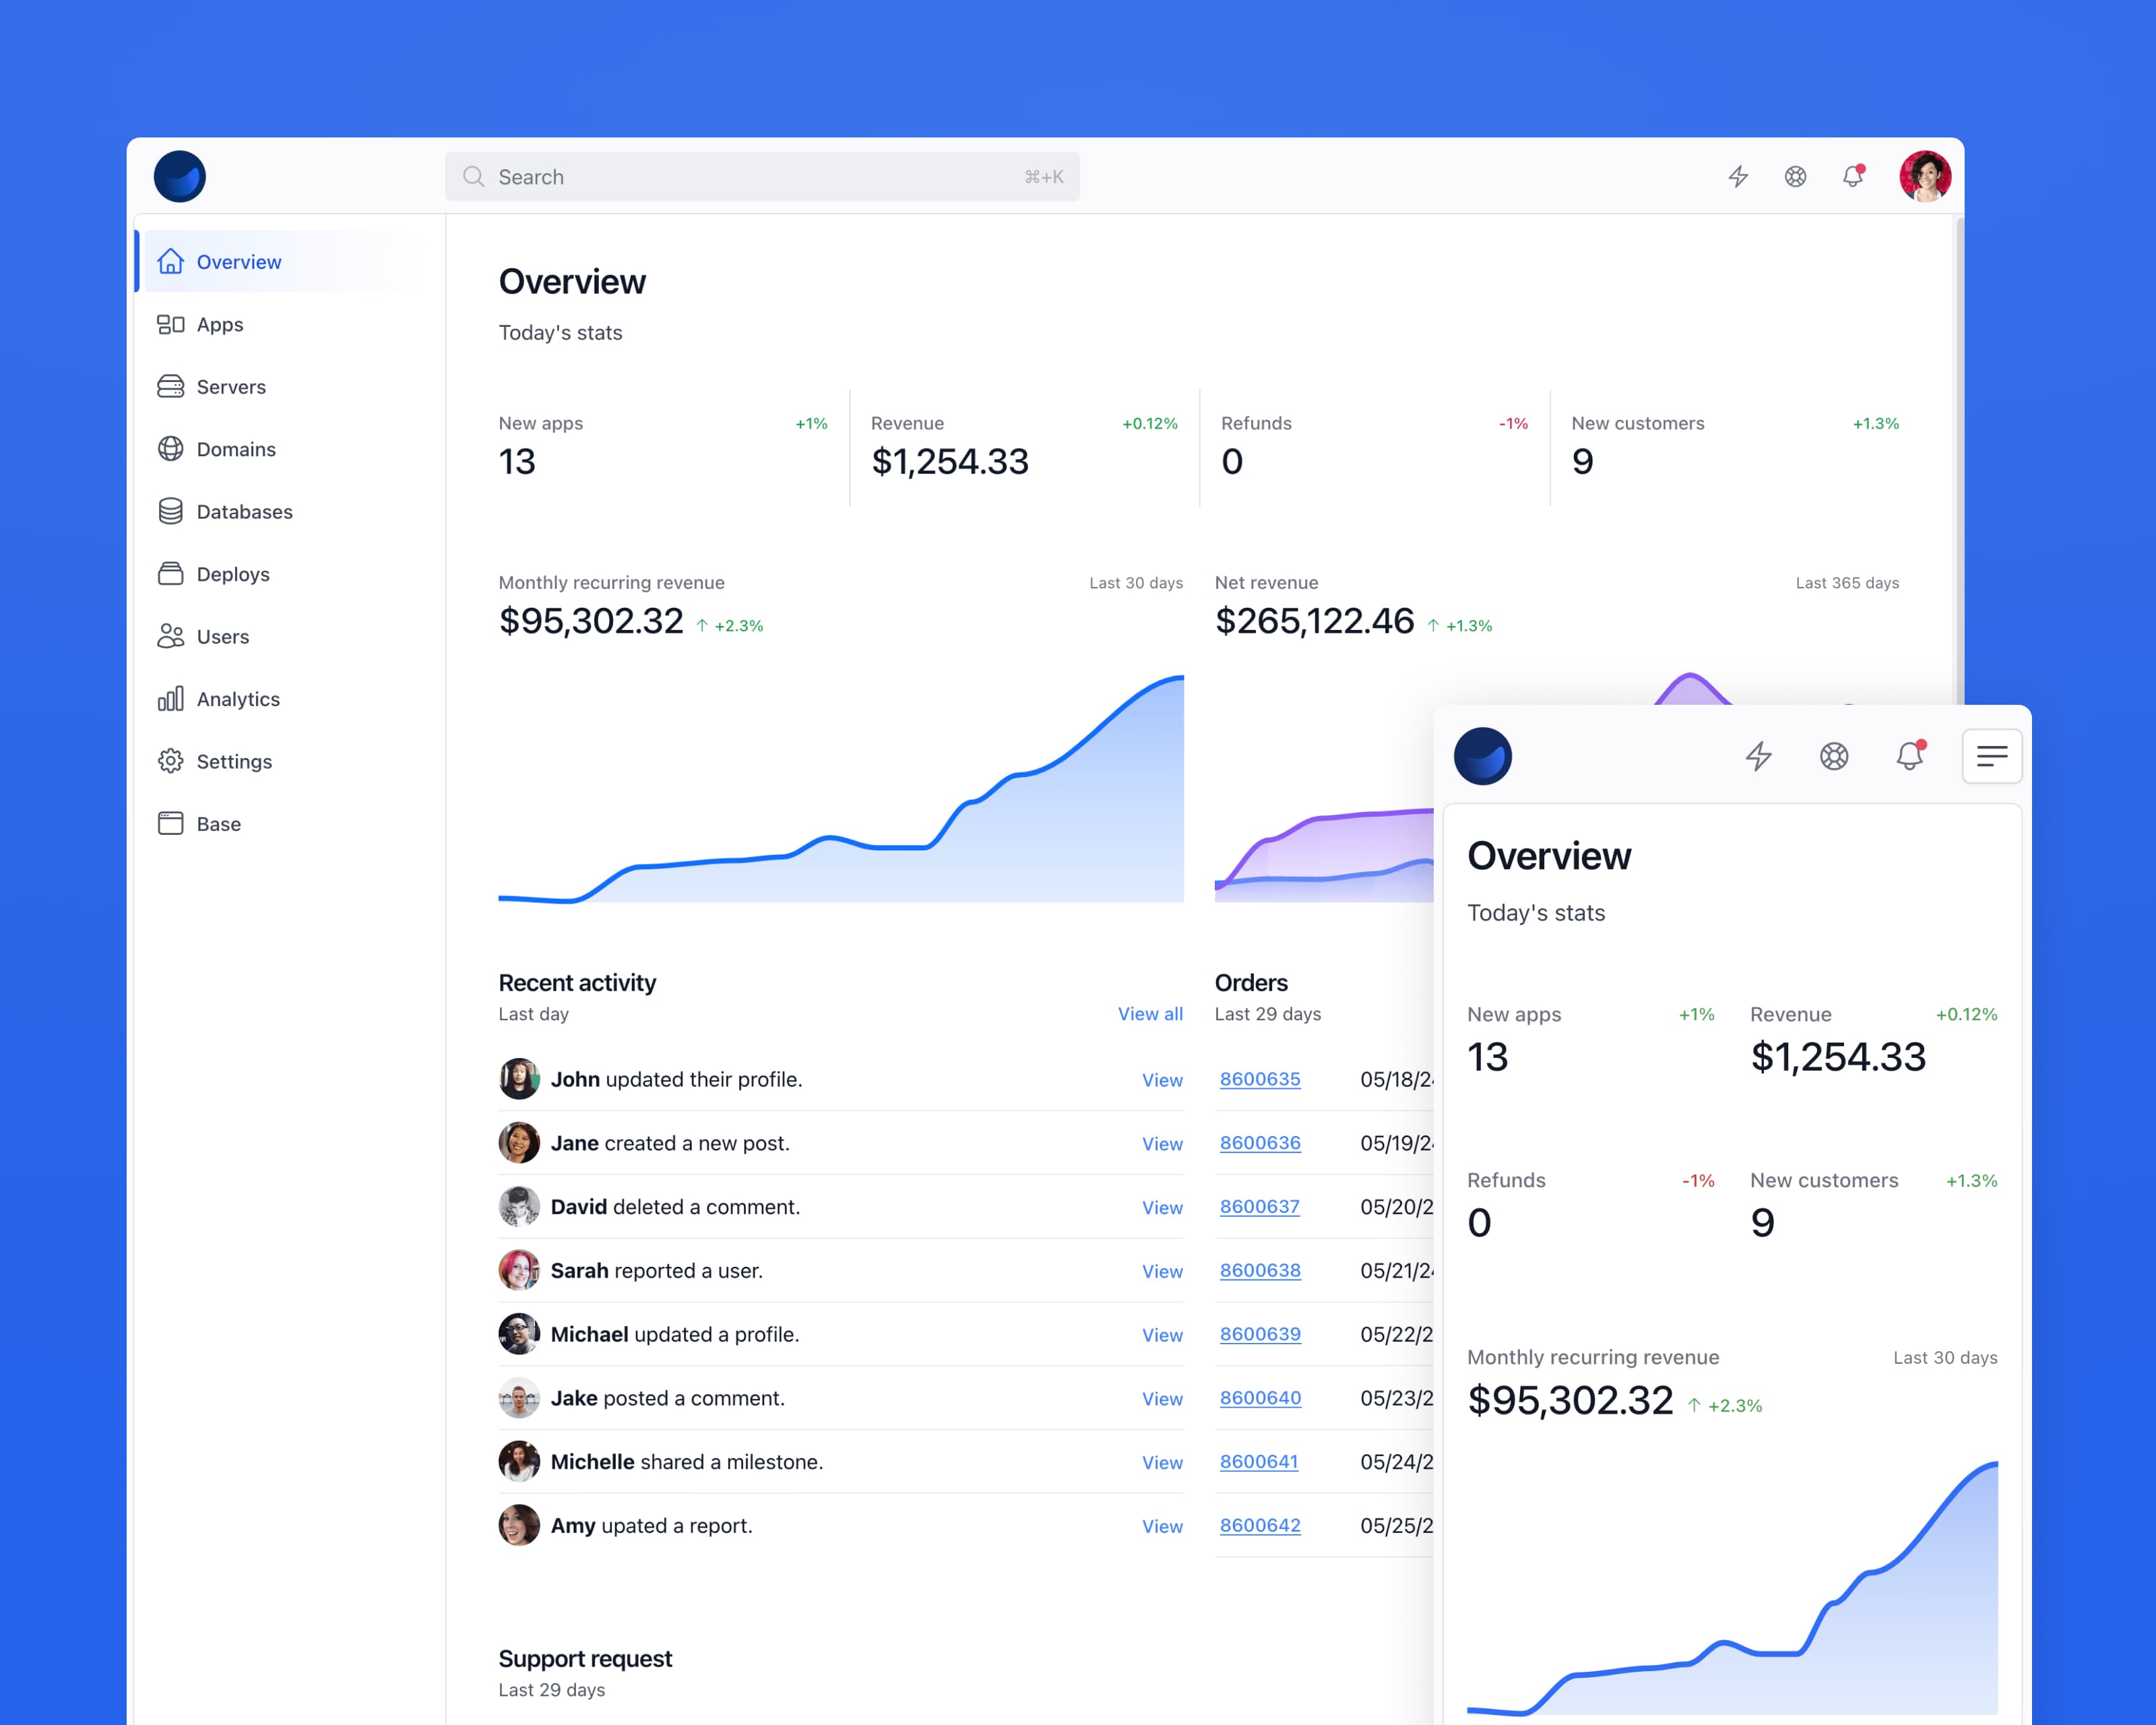
The Retriever app kit offers a technical, focused aesthetic perfect for developer tools. With components designed for status displays, metrics, and log viewing, you can build a professional infrastructure dashboard quickly.
Key components for server management
Status indicators
Health badges and uptime indicators for servers and services.
Metrics cards
Display CPU, memory, and network usage with visual gauges.
Log viewers
Monospace displays for deployment logs and server output.
Data tables
Manage servers, domains, and deployments in dense, scannable tables.
Configuration forms
Settings panels for environment variables and server configuration.
Timeline views
Deployment history and activity feeds with timestamps.
Recommended app kit: Retriever
Retriever's technical aesthetic and information-dense layouts make it ideal for infrastructure and DevOps dashboards where data clarity is paramount.